语义分割中,标注或者输出的 mask,与原始图片的一一对应,将图片与 mask 一起显示,即,将 mask 和其轮廓显示在原始图片上,是一种很好的可视化.
假设图片只有两种类:人(person) 和背景(background),如图:
- 原图.jpg:

- Mask.png:

这里给出两个可视化方法:
- 基于 opencv 实现图片和mask(包括轮廓) 的可视化
- Tensorflow DeepLab 实现的可视化
1. 基于 OpenCV 实现
imgfile = 'image.jpg'
pngfile = 'mask.png'

img = cv2.imread(imgfile, 1)
mask = cv2.imread(pngfile, 0)

contours, _ = cv2.findContours(mask, cv2.RETR_TREE, cv2.CHAIN_APPROX_SIMPLE)
cv2.drawContours(img, contours, -1, (0, 0, 255), 1)

img = img[:, :, ::-1]
img[..., 2] = np.where(mask == 1, 255, img[..., 2])

plt.imshow(img)
plt.show()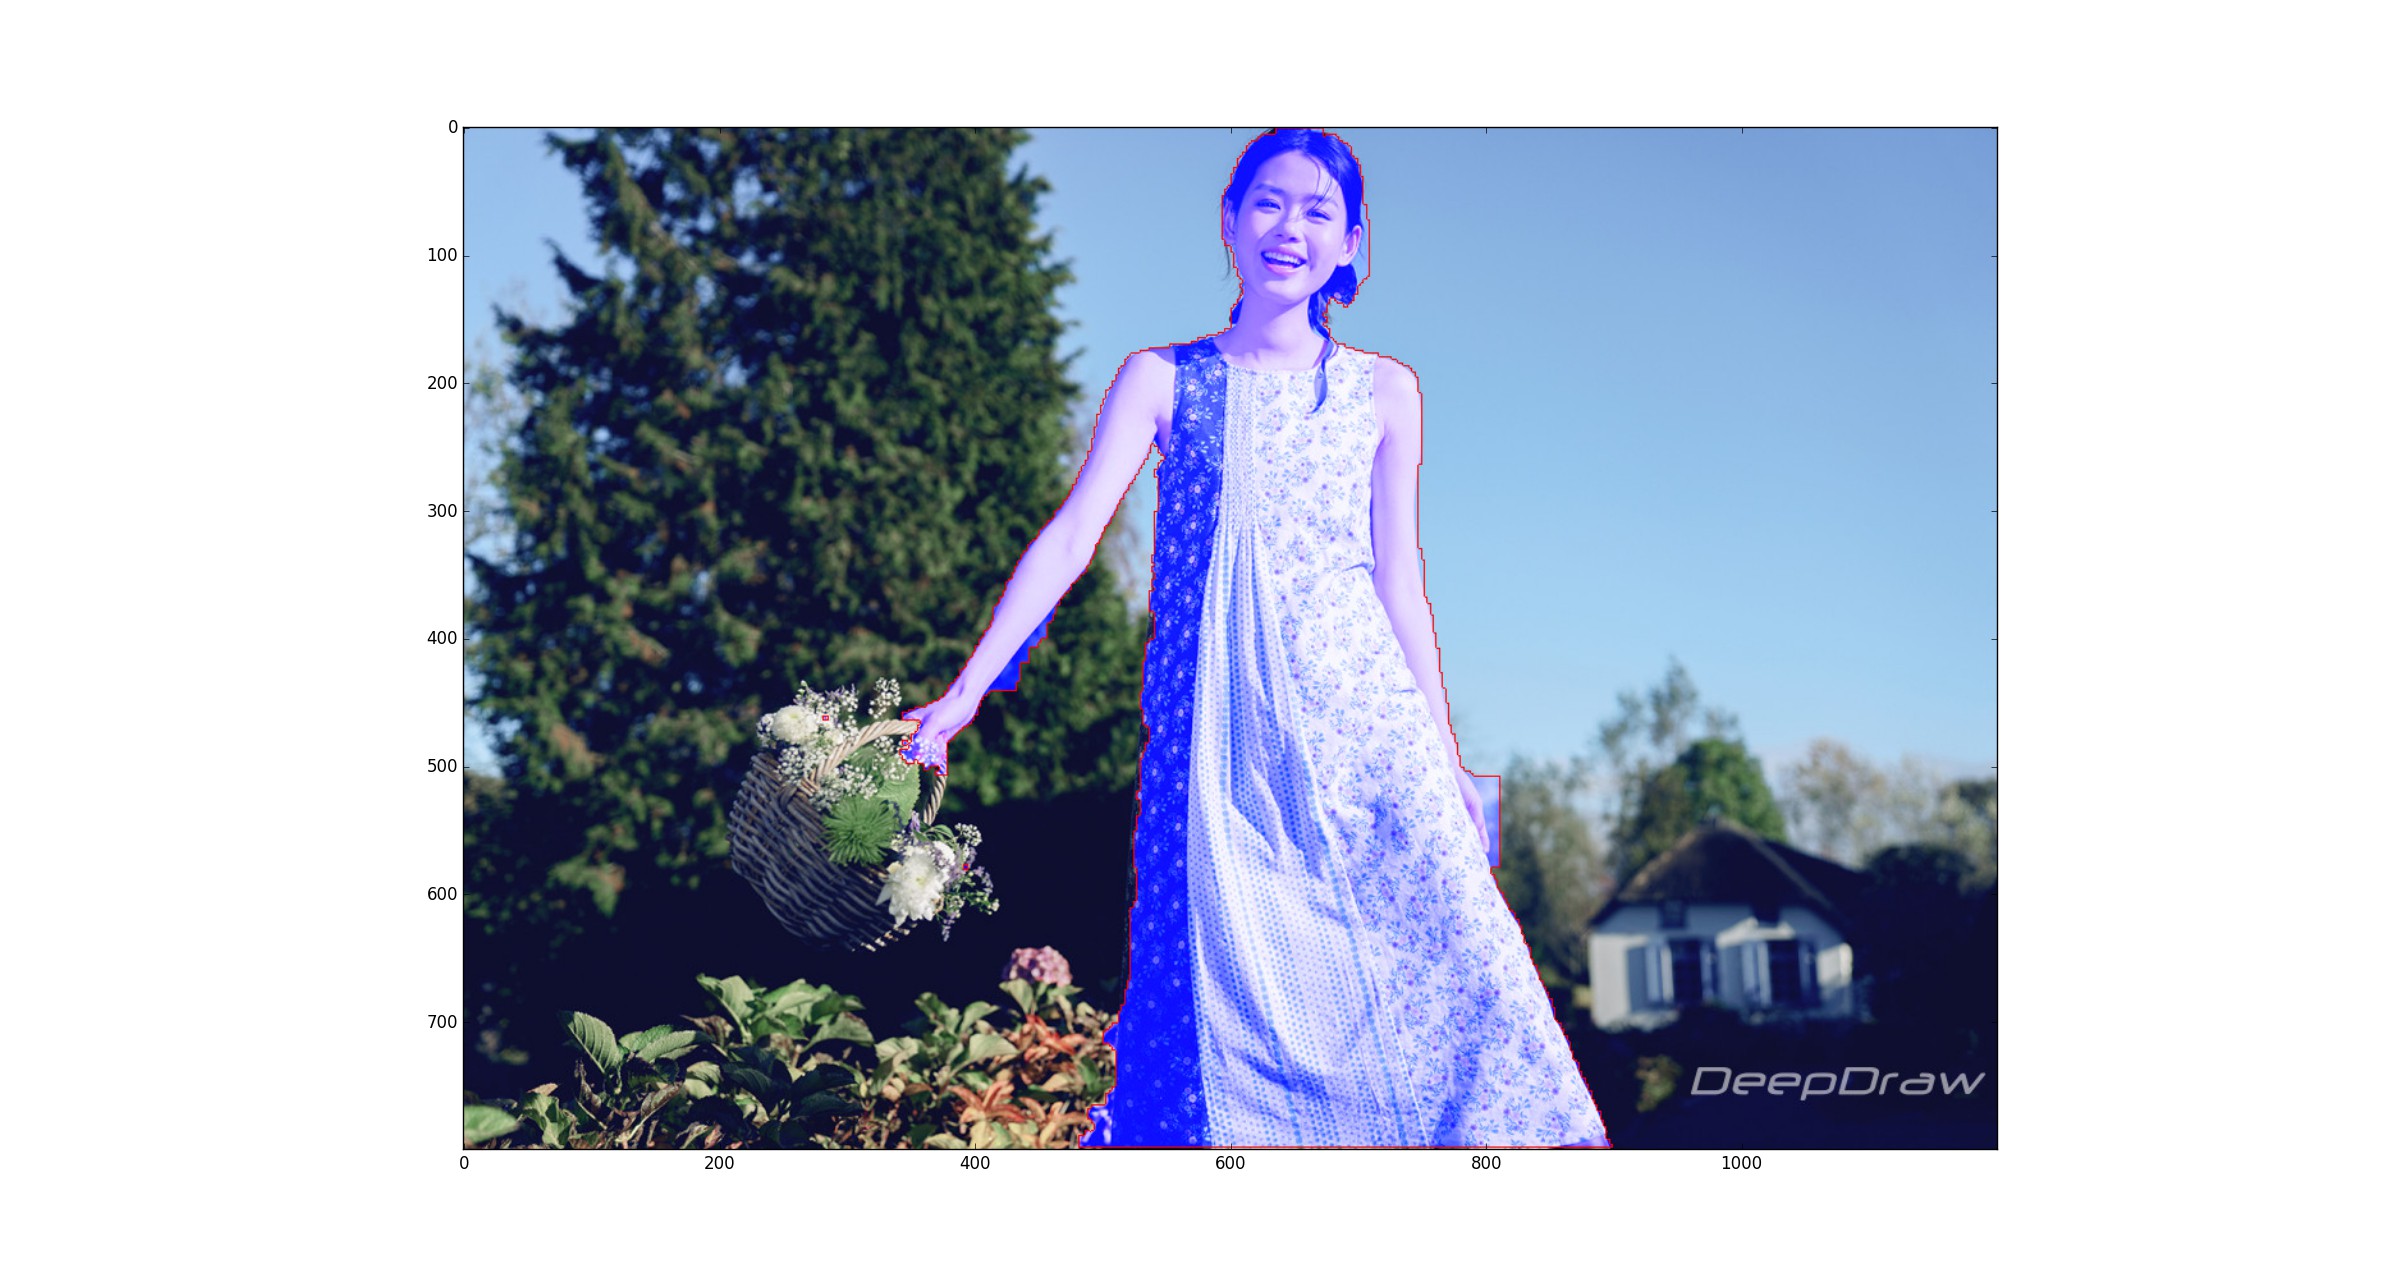
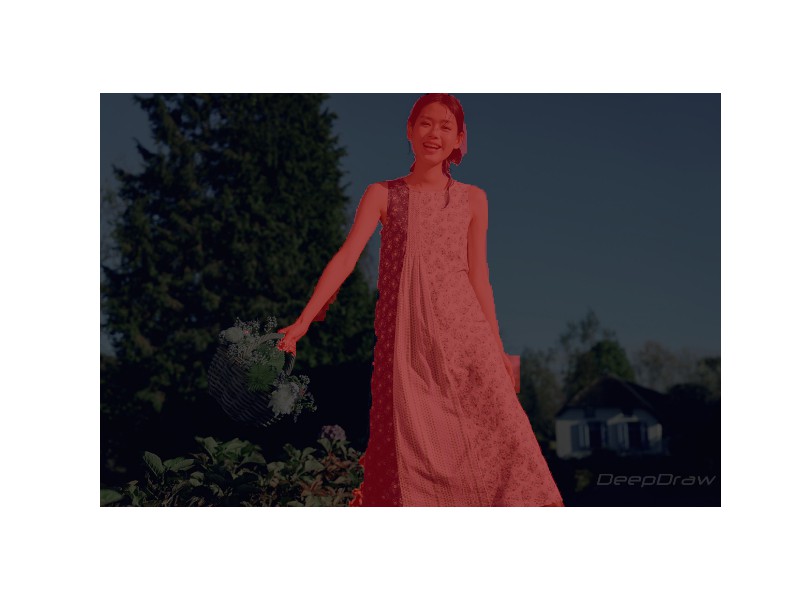
2. Tensorflow DeepLab 实现的可视化
原始实现代码:
import matplotlib.pyplot as plt
from matplotlib import gridspec
import numpy as np
import cv2

def create_pascal_label_colormap():
    """
    PASCAL VOC 分割数据集的类别标签颜色映射label colormap

    返回:
        可视化分割结果的颜色映射Colormap
    """
    colormap = np.zeros((256, 3), dtype=int)
    ind = np.arange(256, dtype=int)

    for shift in reversed(range(8)):
        for channel in range(3):
            colormap[:, channel] |= ((ind >> channel) & 1) << shift
        ind >>= 3

    return colormap

def label_to_color_image(label):
    """
    添加颜色到图片,根据数据集标签的颜色映射 label colormap

    参数:
        label: 整数类型的 2D 数组array, 保存了分割的类别标签 label

    返回:
        result: A 2D array with floating type. The element of the array
        is the color indexed by the corresponding element in the input label
        to the PASCAL color map.

    Raises:
        ValueError: If label is not of rank 2 or its value is larger than color
        map maximum entry.
    """
    if label.ndim != 2:
        raise ValueError('Expect 2-D input label')

    colormap = create_pascal_label_colormap()

    if np.max(label) >= len(colormap):
        raise ValueError('label value too large.')

    return colormap[label]

def vis_segmentation(image, seg_map):
    """
    输入图片和分割 mask 的可视化.
    """
    plt.figure(figsize=(15, 5))
    grid_spec = gridspec.GridSpec(1, 4, width_ratios=[6, 6, 6, 1])

    plt.subplot(grid_spec[0])
    plt.imshow(image)
    plt.axis('off')
    plt.title('input image')

    plt.subplot(grid_spec[1])
    seg_image = label_to_color_image(seg_map).astype(np.uint8)
    plt.imshow(seg_image)
    plt.axis('off')
    plt.title('segmentation map')

    plt.subplot(grid_spec[2])
    plt.imshow(image)
    plt.imshow(seg_image, alpha=0.7)
    plt.axis('off')
    plt.title('segmentation overlay')

    unique_labels = np.unique(seg_map)
    ax = plt.subplot(grid_spec[3])
    plt.imshow(FULL_COLOR_MAP[unique_labels].astype(np.uint8), interpolation='nearest')
    ax.yaxis.tick_right()
    plt.yticks(range(len(unique_labels)), LABEL_NAMES[unique_labels])
    plt.xticks([], [])
    ax.tick_params(width=0.0)
    plt.grid('off')
    plt.show()

LABEL_NAMES = np.asarray(['background', 'person']) # 假设只有两类
FULL_LABEL_MAP = np.arange(len(LABEL_NAMES)).reshape(len(LABEL_NAMES), 1)
FULL_COLOR_MAP = label_to_color_image(FULL_LABEL_MAP)

imgfile = 'image.jpg'
pngfile = 'mask.png'
img = cv2.imread(imgfile, 1)
img = img[:,:,::-1]
seg_map = cv2.imread(pngfile, 0)
vis_segmentation(img, seg_map)

print('Done.')
精简部分:
def vis_segmentation2(image, seg_map):
    """
    输入图片和分割 mask 的统一可视化.
    """
    seg_image = label_to_color_image(seg_map).astype(np.uint8)
    plt.figure()
    plt.imshow(image)
    plt.imshow(seg_image, alpha=0.7)
    plt.axis('off')
    plt.show()
输出结果:
- vis_segmentation():

- vis_segmentation2():
10 条评论
您好,我的Tensorflow DeepLab调出来plt.imshow报这样的错IndexError: index 2 is out of bounds for axis 0 with size 2,改怎么办。还有第一个轮廓内部没有填充,这个可以加吗?
具体是哪里的报错呢?
您好,这句话报错plt.imshow(FULL_COLOR_MAP[unique_labels].astype(np.uint8), interpolation='nearest', )
FULL_COLOR_MAP 由 FULL_LABEL_MAP 决定,FULL_LABEL_MAP 由 LABEL_NAMES 决定,LABEL_NAMES 是分割的类别数,如两类的['background', 'person']. 根据你场景来设定就可以,比如COCO是80+1 个类.
可以分割出来吗?
可以
因为我在做医学图像,要是用cv2就得把医学图像(单通道灰度图)转码成cv2能用的格式,但cv2支持的格式要么是三通道图像,要么会有损压缩...请问这种情况应该怎么办呢?
cv2 也可以读取单通道的图片,cv2.imread(filename, arg),设置 arg 参数
您好,请问在python上把语义分割结果和原图像相叠加的库除了opencv和PIL,还有其他的库可以用吗?
也可以自己用 numpy 来实现.