图像的颜色直方图表征了图像的明暗程度,其中,X 轴从左到右依次表示从暗到亮(0-255),最左边为最暗的纯黑色(0),最右边为最亮的纯白色(255);Y轴表示像素数量.
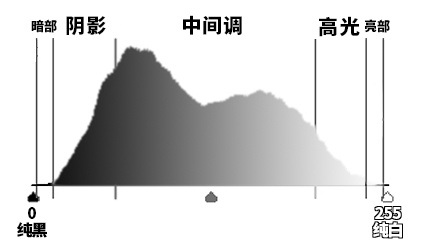
根据直方图,可以大致估计照片的曝光情况,如果数据主要集中在左边,图像可能是欠曝的;而集中在左边,则可能是过曝. 如果数据分布均匀,大多集中于中间地带,说明照片的色调多为中间调,不会太暗,也不会太亮.
https://www.zhihu.com/zvideo/1464534721841106944
Python 实现
Python 实现如:
import cv2
import numpy as np
import matplotlib.pyplot as plt
#
image = cv2.imread("test.jpg")
'''
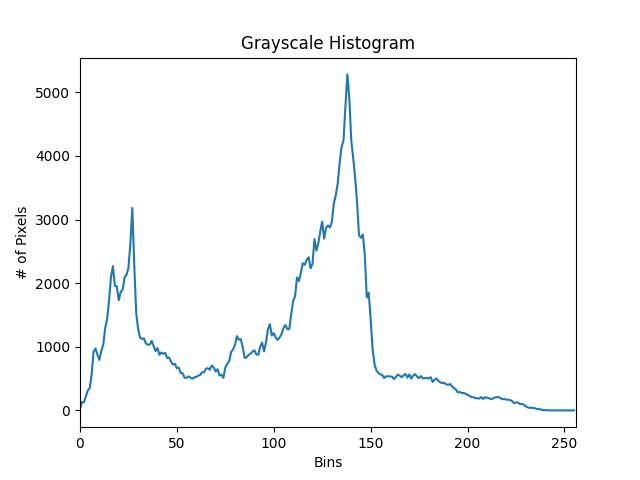
灰度直方图
'''
gray = cv2.cvtColor(image, cv2.COLOR_BGR2GRAY)
hist = cv2.calcHist([gray], [0], None, [256], [0, 256])
plt.figure()
plt.title("Grayscale Histogram")
plt.xlabel("Bins")
plt.ylabel("# of Pixels")
plt.plot(hist)
plt.xlim([0, 256])
plt.show()
'''
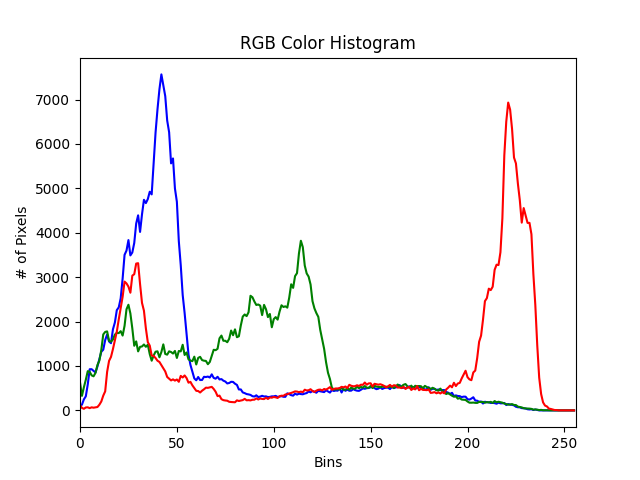
r、g、b 通道直方图
'''
chans = cv2.split(image)
colors = ("b", "g", "r")
plt.figure()
plt.title("RGB Color Histogram")
plt.xlabel("Bins")
plt.ylabel("# of Pixels")
features = []
for (chan, color) in zip(chans, colors):
# 对各通道计算直方图
hist = cv2.calcHist([chan], [0], None, [256], [0, 256])
features.extend(hist)
plt.plot(hist, color = color)
plt.xlim([0, 256])
plt.show()
print("flattened feature vector size: %d" % (np.array(features).flatten().shape))
'''
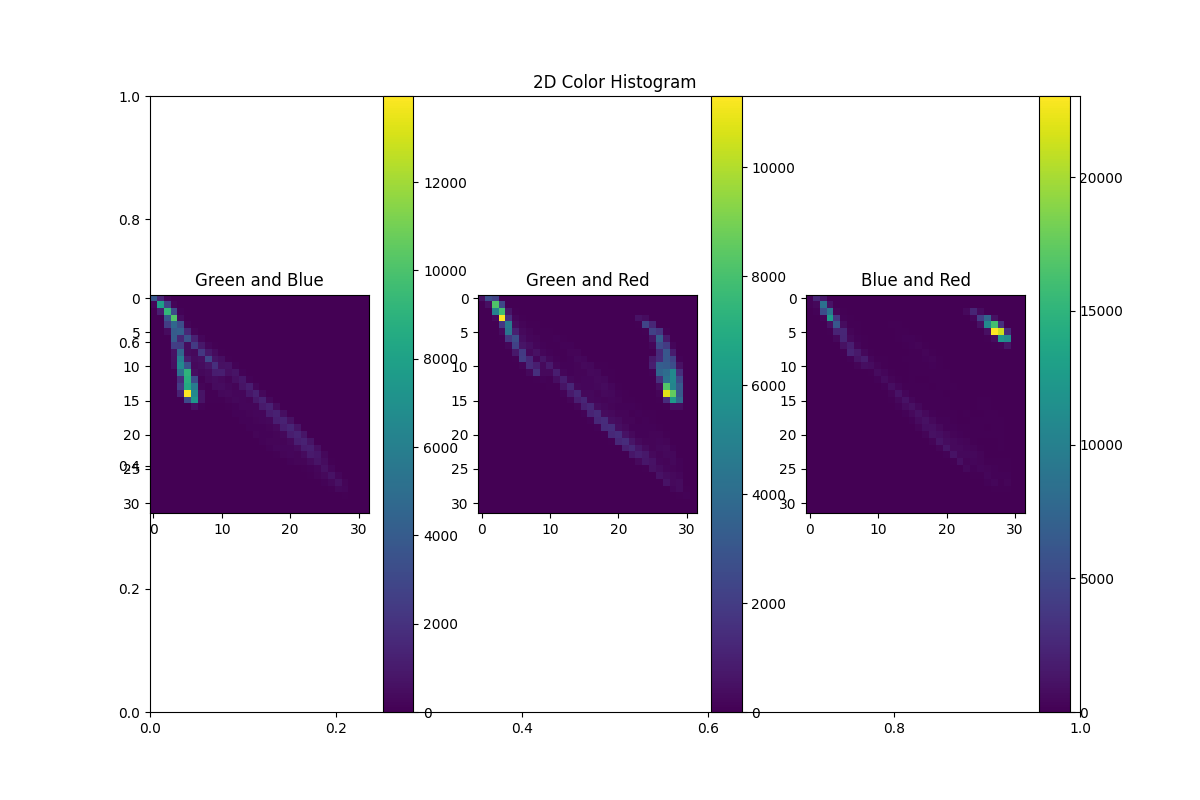
2D 直方图
'''
fig = plt.figure()
plt.title("RGB Color Histogram")
# 2D 颜色直方图: green and blue
ax = fig.add_subplot(131)
hist = cv2.calcHist([chans[1], chans[0]], [0, 1], None,
[32, 32], [0, 256, 0, 256]) #256 -> 32 bins
p = ax.imshow(hist, interpolation = "nearest")
ax.set_title("Green and Blue")
plt.colorbar(p)
# 2D 颜色直方图: green and red
ax = fig.add_subplot(132)
hist = cv2.calcHist([chans[1], chans[2]], [0, 1], None,
[32, 32], [0, 256, 0, 256])
p = ax.imshow(hist, interpolation = "nearest")
ax.set_title("Green and Red")
plt.colorbar(p)
# 2D 颜色直方图: blue and red
ax = fig.add_subplot(133)
hist = cv2.calcHist([chans[0], chans[2]], [0, 1], None,
[32, 32], [0, 256, 0, 256])
p = ax.imshow(hist, interpolation = "nearest")
ax.set_title("Blue and Red")
plt.colorbar(p)
plt.show()
print ("2D histogram shape: %s, with %d values" % (
hist.shape, hist.flatten().shape[0]))
'''
3D 直方图
'''
hist = cv2.calcHist([image], [0, 1, 2],
None, [8, 8, 8], [0, 256, 0, 256, 0, 256])
print ("3D histogram shape: %s, with %d values" % (
hist.shape, hist.flatten().shape[0]))
plt.show()如:
参考
[1] - 今天来讲讲:直方图 - 知乎
[2] - 直方图的高度有什么意义?- 知乎
[3] - 如何看懂照片的直方图?- 知乎
2 条评论
你图片裂开了OωO
知乎的视频外链。。。挂了,直接点击链接跳转