VLAD 是论文 Aggregating local descriptors into a compact image representation - 2010 中提出的一种图像表示方法.
基于 BoW 模型的方法在图像的检索和检索中有这广泛的应用. BoW 模型通过聚类,对图像的局部特征进行重新编码,有很强的表示能力. 但是在图像规模比较大的情况下,由于视觉词典 Vocabulary 大小的限制,BoW 模型对图像的表示会越来越粗糙,编码后损失的图像信息较多,检索精度也随之而降低.
VLAD 是一种将局部图像特征聚合到有限维的向量,其可以看做是 Fisher Kernel 表示的简化形式.
1. VLAD 处理流程
对于待处理图像,
[1] - 提取SIFT特征
对于一个样本数为 N 的数据库,先对图像库中的所有图像提取SIFT描述子,假设提取到了所有SIFT描述子数目为n, 用X来表示的话,X就是一个n*128的矩阵.
[2] - 聚类生成词汇向量
假设要生成K个单词,对 X 直接用Kmeans聚成 K 类,类中心即为单词(也叫码字).
[3] - 生成VLAD向量
BoW 模型统计的是每个特征词汇在图像中出现的频率,或,描述子落入最近单词里的数目.
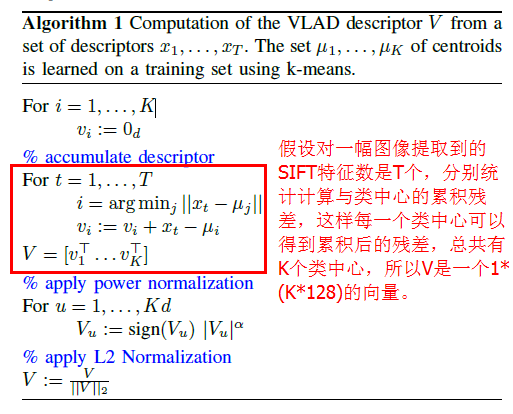
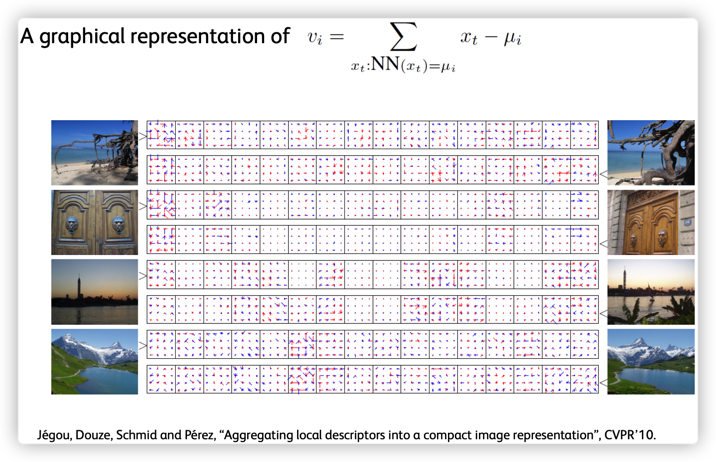
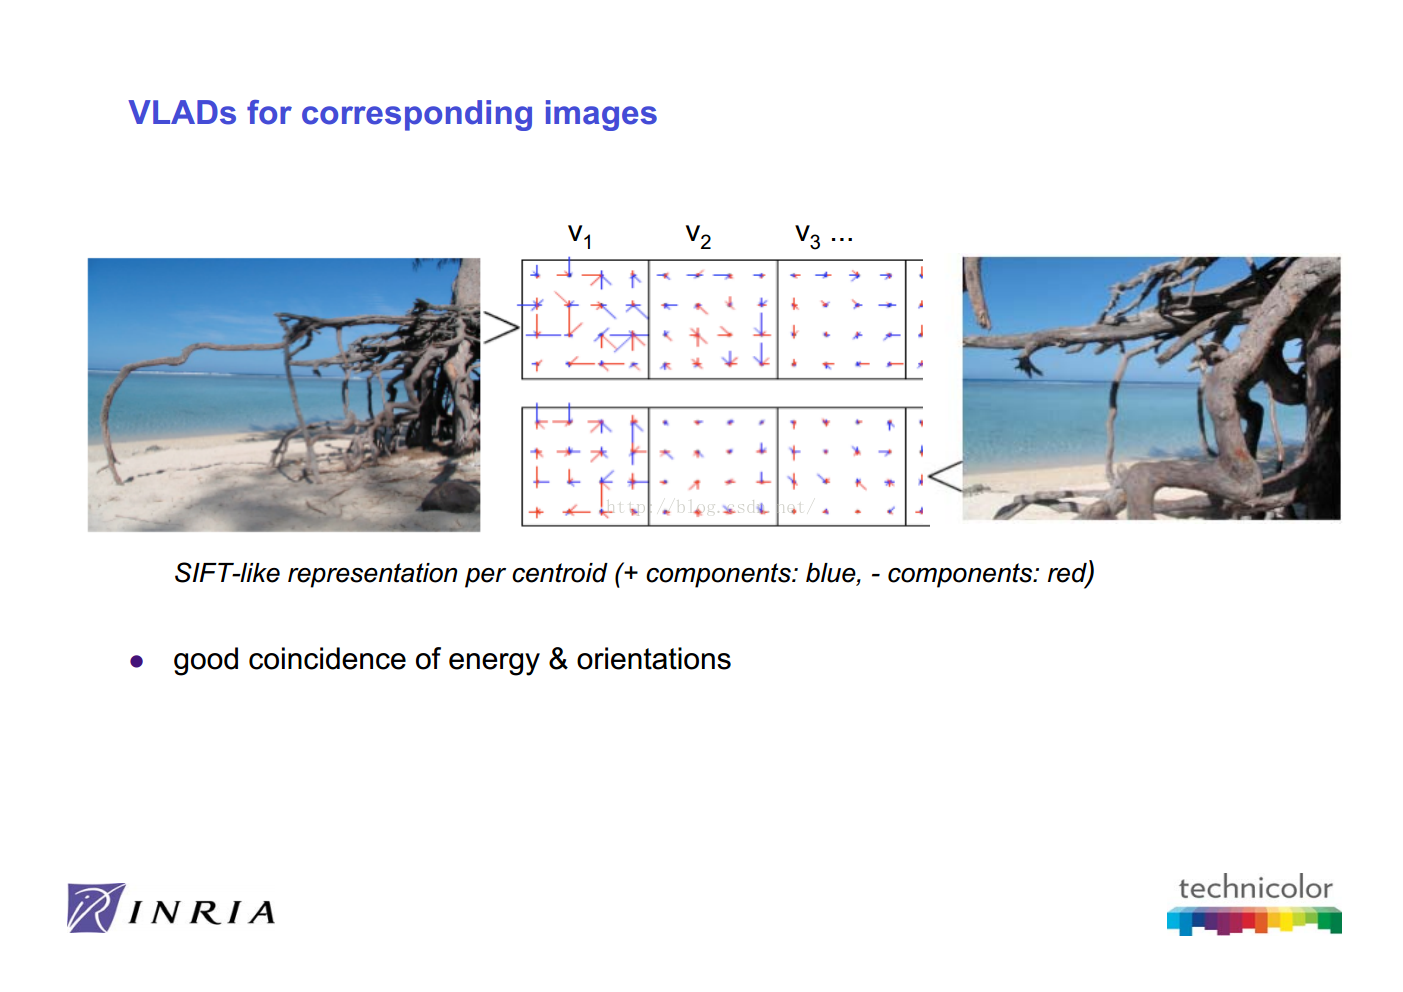
VLAD 则是求落在同一个聚类中心的特征和该聚类中心残差的累加和,或,这些落入最近单词里与该单词的累积残差.
2. VLAD 算法流程
如图:
http://people.rennes.inria.fr/Herve.Jegou/courses/2012_cpvr_tutorial/4-new-patch-agggregation.pptx.pdf

图:
http://people.rennes.inria.fr/Herve.Jegou/courses/2012_cpvr_tutorial/4-new-patch-agggregation.pptx.pdf
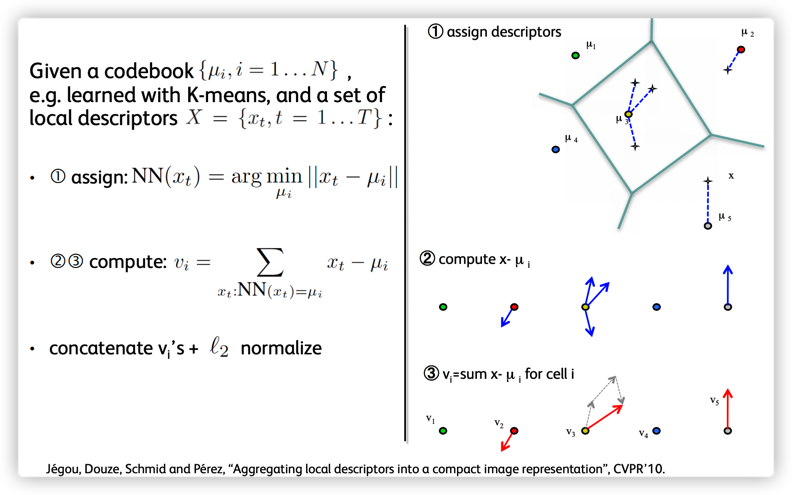
假设图像的第 $j$ 个特征点为 $x_j$,和该特征点最接近的聚类中心为 $c_i$,该特征点和其最接近的聚类中心的差为 $x_j - c_{i,j}$.
$$ v_{i,j} = \sum _{x:NN(x)=c_i} = x_j - c_{i,j} $$
如,如果图像采用的是 SIFT 特征,视觉词汇表的大小(聚类中心数)为 $k$,则可以得到 $k$ 个128 维的向量 $v_{i,j}$.
然后,将 $k * d$ 个向量($d$ 为图像特征维度,如,SIFT 为 128 维) $v_{i,j}$ 拉伸为一个 $k * d$ 长度的一维向量;
接着将拉伸后的向量做 L2 归一化,即可得到图像的 VLAD 表示.
此外,由于 VLAD 是特征和其最邻近的聚类中心的残差和,该向量的很多分量都为0,也就是说该向量是稀疏的,所以可以对VLAD进行降维处理(如PCA)进一步缩小向量的大小.
3. VLAD 实现
https://github.com/jorjasso/VLAD/blob/master/VLADlib/VLAD.py
https://github.com/Lithogenous/VLAD-SIFT-python/blob/master/vlad_raw.py
import cv2
import numpy as np

#doc at http://docs.opencv.org/master/d5/df7/classcv_1_1xfeatures2d_1_1SURF.html
def describeSURF(image):
    surf = cv2.xfeatures2d.SURF_create()
    # it is better to have this value between 300 and 500
    surf.setHessianThreshold(400)
    kp, des = surf.detectAndCompute(image,None)
    return kp,des

#doc at http://docs.opencv.org/master/d5/d3c/classcv_1_1xfeatures2d_1_1SIFT.html
def describeSIFT(image):
    sift = cv2.xfeatures2d.SIFT_create()
    #sift = cv2.xfeatures2d.SIFT_create(nfeatures=500)
    kp, des = sift.detectAndCompute(image,None)
    #draw keypoints
    #import matplotlib.pyplot as plt
    #img2 = cv2.drawKeypoints(img,kp,None,(255,0,0),4)
    #plt.imshow(img2),plt.show()
    return kp,des

def describeORB( image):
    #An efficient alternative to SIFT or SURF
    #doc http://docs.opencv.org/3.0-beta/doc/py_tutorials/py_feature2d/py_orb/py_orb.html
    #ORB is basically a fusion of FAST keypoint detector and BRIEF descriptor
    #with many modifications to enhance the performance
    orb=cv2.ORB_create()
    kp, des=orb.detectAndCompute(image,None)
    return kp,des


def VLAD(X,visualDictionary):
    predictedLabels = visualDictionary.predict(X)
    centers = visualDictionary.cluster_centers_
    labels = visualDictionary.labels_
    k = visualDictionary.n_clusters

    m,d = X.shape
    V=np.zeros([k,d])
    #computing the differences
    #for all the clusters (visual words)
    for i in range(k):
        #if there is at least one descriptor in that cluster
        if np.sum(predictedLabels==i)>0:
            #add the differences
            V[i]=np.sum(X[predictedLabels==i,:]-centers[i],axis=0)

    V = V.flatten()
    #power normalization, also called square-rooting normalization
    V = np.sign(V)*np.sqrt(np.abs(V))

    #L2 normalization
    V = V/np.sqrt(np.dot(V,V))

    return V

#
img_cv2 = cv2.imread('test.jpg')
kp, descriptor=describeSIFT(img_cv2)

#compute VLAD
v=VLAD(descriptor,visualDictionary)
4. 参考
[1] - VLAD - 2014.07.02
[2] - 图像检索(4):IF-IDF,RootSift,VLAD-2018.08.13
[3] - Aggregating local descriptors into a compact image representation(阅读) - 2016.07.04
[4] - 图像检索:BoF、VLAD、FV三剑客 - 2015.07.19
[5] - 图像检索——VLAD - 2017.05.26
1 条评论
学到了学到了