基于 Python 和 OpenCV 画出多边形,以及判断某个点是不是在多边形内.
1. cv2.polylines() 函数
函数定义:
import cv2
img = cv2.polylines(img, pts, isClosed, color, thickness, lineType, shift)
其中,
pts 是多边形定点构成的矩阵. 将传入的点一次连接.
isClosed - 表示绘制的多边形是否闭合. 如闭合(True),则每个曲线的最后一个顶点到第一个顶点是连接的. 若不闭合(False),则多边形就不闭合.
示例1,如:
#!/usr/bin/python3
#!--*-- coding: utf-8 --*--
import cv2
import numpy as np
import matplotlib.pyplot as plt

# 纯白图像
img = np.zeros((500,500,3), np.uint8)
img[:] = [255,255,255]

#四个顶点坐标
pts = np.array([[100, 100], [200, 20], [370, 6], [450, 200]], np.int32)
#顶点个数:4,矩阵变成4*1*2维
pts = pts.reshape((-1, 1, 2))
cv2.polylines(img, [pts], True, (0, 255, 255))

#
plt.figure(figsize=(8, 8))
plt.imshow(img[:, :, ::-1])
plt.show()
示例2,如:
#!/usr/bin/python3
#!--*-- coding: utf-8 --*--
import cv2
import numpy as np

# 灰色图
img = np.zeros((500, 500, 3), np.uint8)
img[:] = (128, 128, 128)

pts = np.array([[200, 200], [300, 100], [400, 200], [400, 400], [200, 400]], np.int32)
red_color = (0, 0, 255)
cv2.polylines(img, pts=[pts], isClosed=True, color=red_color, thickness=3)

cv2.imshow('Polylines', img)
cv2.waitKey(0)
2. cv2.pointPolygonTest() 函数
函数定义:
cv2.pointPolygonTest(contour, pt, measureDist)函数功能:找到图像里的点和轮廓之间的最短距离. 它返回的距离当点在轮廓外的时候是负值,当点在轮廓内是正值,如果在轮廓上是0.
其中,contour 为轮廓多边形;pt 为坐标点;measureDist, 若为True,是找带符号的距离;若为False,会找点是否在内,外,或轮廓上(相应返回+1, -1, 0).
示例,如:
#!/usr/bin/python3
#!--*-- coding: utf-8 --*--
import cv2
import numpy as np
import matplotlib.pyplot as plt
# 纯白图像
img = np.zeros((500,500,3), np.uint8)
img[:] = [255,255,255]
# BGR
red_color = (0, 0, 255)
blue_color = (255, 0, 0)
#四个顶点坐标
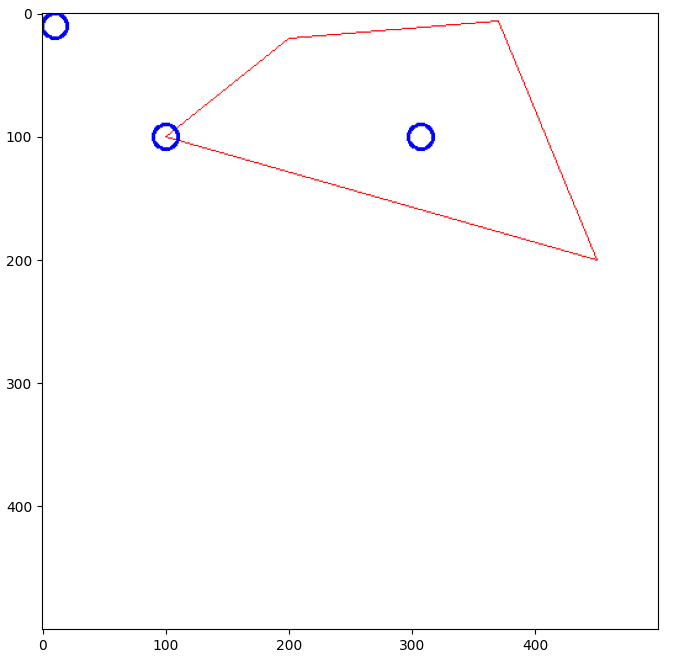
pts = np.array([[100, 100], [200, 20], [370, 6], [450, 200]], np.int32)
#顶点个数:4,矩阵变成4*1*2维
pts = pts.reshape((-1, 1, 2))
cv2.polylines(img, [pts], True, red_color)
# Line thickness of 2 px
radius = 10
thickness = 2
#
img = cv2.circle(img, (100,100), radius, blue_color, thickness)
dist1=cv2.pointPolygonTest(pts,(100,100),True)
# -0.0
img = cv2.circle(img, (10,10), radius, blue_color, thickness)
dist2=cv2.pointPolygonTest(pts,(10,10),True)
# -127.27922061357856
img = cv2.circle(img, (307,100), radius, blue_color, thickness)
dist3=cv2.pointPolygonTest(pts,(307,100),True)
# 56.867273474757255
#
plt.figure(figsize=(8, 8))
plt.imshow(img[:, :, ::-1])
plt.show()